
In the last post I wrote about the causes of obesity and the common assumption that changes in our food intake are the cause. In particular the idea that we’re all eating more in the way of sugars and that this is what is causing the ‘obesity crisis’. Unfortunately the data from the UK government refused to go along with those assumptions. Surprisingly perhaps what the data showed was that our calorie intake has declined since 2001, and that this decline is across the major food classes – fats, proteins and carbs have all gone down over that period. What’s more, as the figures I pulled up showed, the proportions of energy intake from those three food groups has remained pretty constant.
One of the comments raised in response to those figures is that there must be some socio-economic factors hidden in the data, which combined all groups into one statistical average. So, the next thing is to just take a peek at the more granular detail to see what’s lurking. To that end, here’s a look at the total calorie intake for the lowest, middle and highest deciles (10% bands):
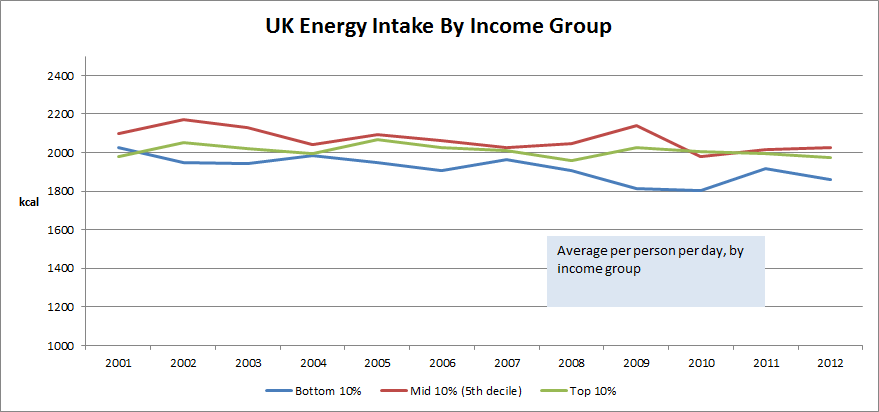 In terms of trends, they’re all headed in the same direction and pretty much at the same rate.
OK, but again, that’s total energy from all sources. What about carbs, which is the villain of the moment when it comes to public policy:
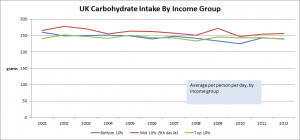
Again, the trends are all in line across the groups. So what about sugar rather than carbohydrates as a whole?
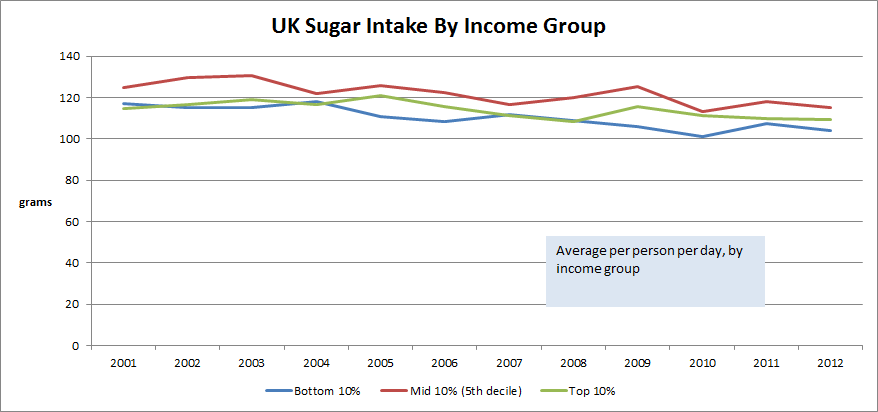 No change, it’s all broadly in line. And the common idea that lower income groups have got the worst diet in terms of sugar – well, it just doesn’t show up in the data.
Yes there are differences between income groups in terms of calorie intake, but there’s nothing significant here. There’s certainly nothing there to support the notion that people are massively increasing sugar intake, nor that lower income groups have got higher sugar intakes than upper or middle income groups.
So if it’s not food intake, then what is it? Next time round we can start to dig into the figures on obesity to see what they show.
