
Like most people I’ve accepted as gospel the idea that there is an ‘obesity’ crisis, and that this is due to changes in what we eat. Over time, or so we’ve been led to believe, we’ve been eating more and more, and of this increased food intake we’ve been eating more of the ‘wrong stuff’. Now for a long time the ‘wrong’ stuff was supposed to be fats, especially saturated fats which have been public health enemy No. 1 for years. Fats, we’ve been told, are the cause of heart disease, metabolic syndrome, obesity and cancer. Recently though there’s been something of a backlash as the science behind these public health messages just doesn’t stack up.
So, if fats are no longer the culprit, what is? The new public health enemy is sugar. And now some of the same people who’ve been warning us off fats and on to carbohydrates and sugar and now turning around and proclaiming that it’s the carbs that are behind obesity, cancer and all else that ails us.
But being of a sceptical nature I like to look at the evidence. And in this case there are some really good data sets to look at. For the UK we have the government’s own figures here: https://www.gov.uk/government/statistical-data-sets/family-food-datasets
So, what does the data say? Are we guzzling more and more and eating ourselves fat and unhealthy?
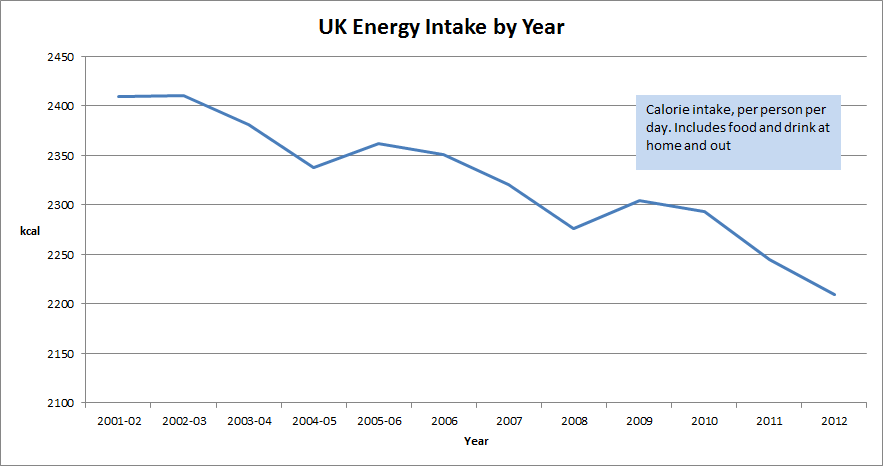
Take a look at the figures for total calorific intake over the last 12 years. Rather than going up, it’s sloping downwards. Now these figures include food and drink consumed at home and out, so it includes food from fast food joints and restaurants.
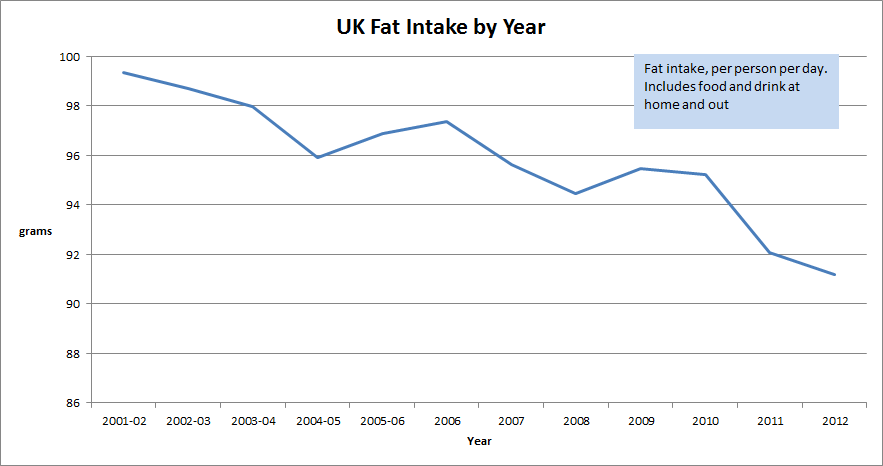
 OK. If it’s not the total calories rising, it must be what’s included, right? So let’s take a look at fat consumption, after all that’s what we’ve been warned off for so long…
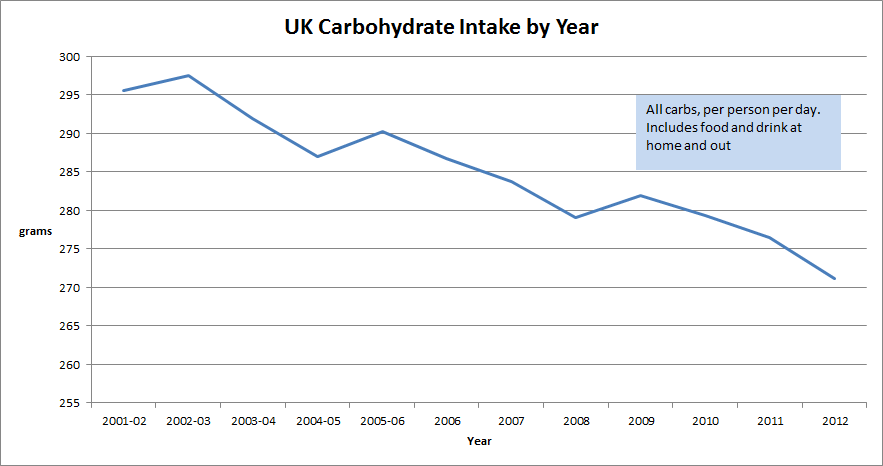
Not fats then. So what about carbs? After all, that’s what we’re increasingly being told to avoid. Damn, it’s the same downward slope.
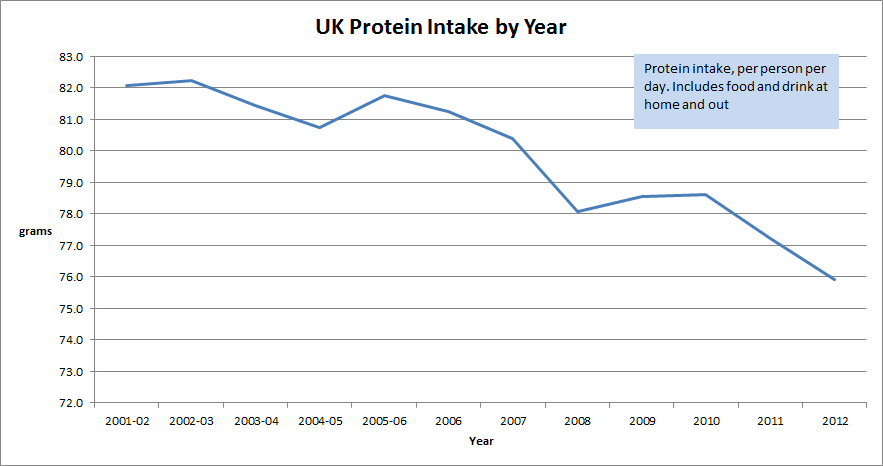
 And the same for protein…
But wait, I hear you say, it’s not carbs as such, it’s the sugars. Complex carbohydrates are a good thing, it’s the sugar that’s the poison. So let’s look at the sugar intake:
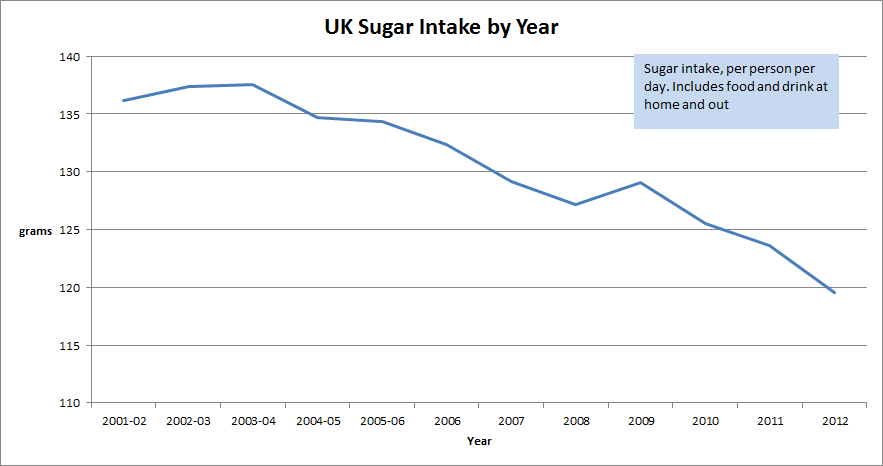
Whoops. Not the sugar increasing either.
Now at this point, being a sceptical kind of guy, I figure what if it’s the relative share of calories from these foods that is to blame? What if they’re all going down, but some are going down faster than others so the share of calories from carbs or fats or proteins is rising?
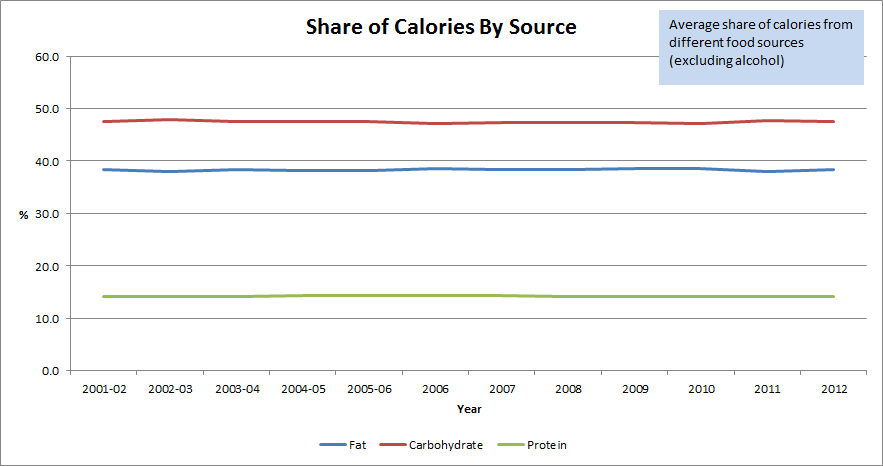 Wrong again. Those lines are pretty straight and show no major changes in share of calories from different food sources.
Where does this leave us? Well, if it’s not us eating more, or more of the ‘wrong’ stuff, then we have to look at other explanations. I’ll come back to what some of these might be in a future post, but for now just look at these graphs and remember them next time you hear someone telling you that we’re getting fatter because we’re eating more of the ‘wrong’ stuff.
